
UP Education provides higher education learning opportunities throughout New Zealand and Australia. For over 20 years they have equipped the next generation with skills and attitudes that will last them a lifetime.
12,000
students from all over New Zealand and across the world
34
campuses in New Zealand and Australia
70+
courses offered across levels 3 to 9 across 11 schools
The business has grown by acquiring multiple schools with varied programmes in its growth phases over the years. With a student base as varied as the programmes and the levels of qualifications, there was a need for a seasoned qualitative user researcher with service design flavour to understand the student base and analyse the goals and motivations to commit to a programme. The fact that the student funding from a channel; Youth Guarantee or study link, only starts after the first 2 weeks of the student being on campus is to be noted here.
It was therefore vital that the goals of the marketing teams were aligned to ensure the right students were targeted through campaigns for the right and most relevant programmes offered by the school(s).
Given that the funding is directly related to the length of the programme, I used that and the number of current students enrolled as a parameter prioritising the programmes to be worked on.
Once a student is acquired in the level 3 or 4 of the knowledge stream, they had the pathway to graduate with a level 7 qualification and be able to work as a qualified teacher by being directly accepted in the 2nd year of the undergraduate programme.
This way, an adult student, who previously had no access to a degree, could join the highly short-staffed teaching workforce and have a chance to escape the minimum wage trap. Equally, the business would lessen their year-on-year acquisition cost by being able to retain the student for longer.
Opportunity
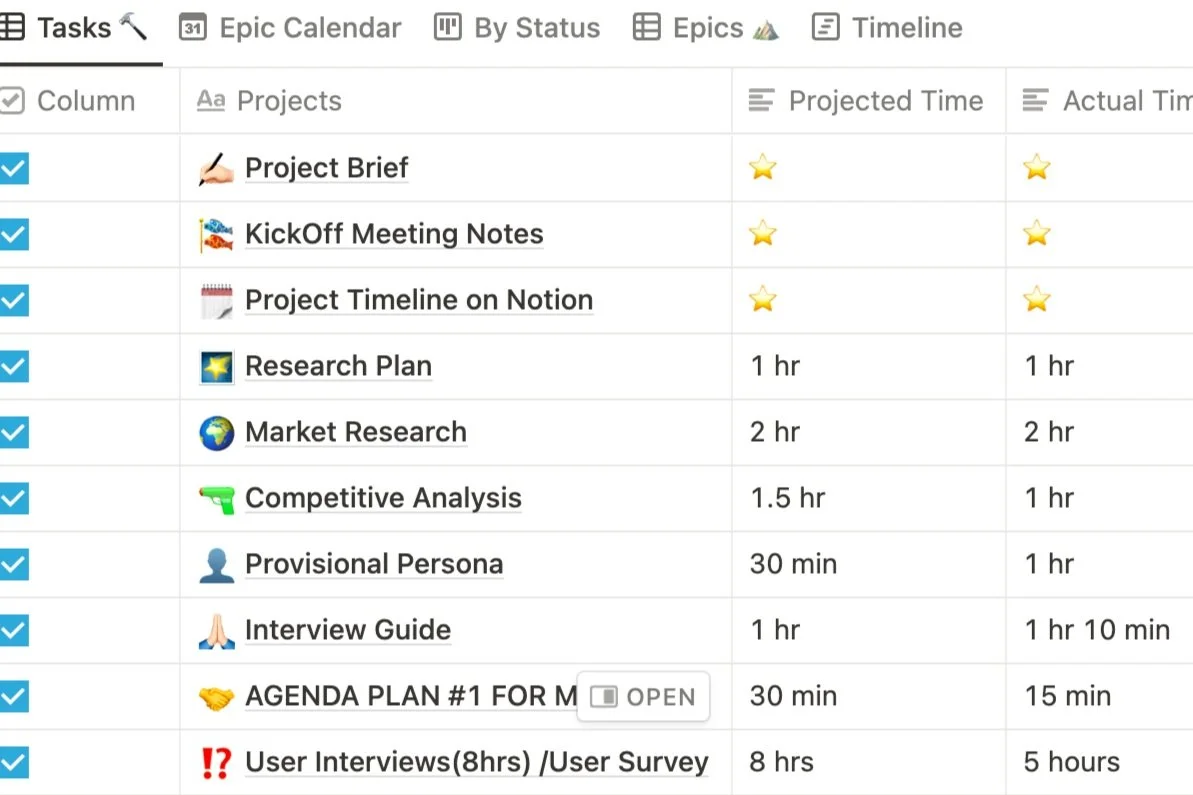
Research Plan
If you fail to plan, you plan to fail. This statement drives all my UXR initiatives. This brings transparency, early agreements and a methodical understanding to an otherwise misunderstood initiative.

Without data, it’s just a story,
Without story, it’s just data.
The business decision was to begin the exercise with the Early Childhood Education programmes that scale from NZQA levels 3 to 7. My preferred method for a similar purpose would have been interviews with the users.
However, given the age of the students and volume of required findings I knew a focus group was required to generate symbiotic energy and trust in the process so as to stir a conversation woven around my list of requirements.
Within a group discussion, I believe in allowing for a working autonomy with alone-together processes. I handed out post it notes for the participants to fill the answers they rather not share publicly. This process proved vital in getting the outcome I was hoping for.
I video recorded the sessions to carefully revisit the exercise. I used the Tomer Sharon’s Rainbow Spreadsheet Method to analyse and observe themes in the session. The generate insights surfaced the needs, wants, goals, motivations and expectations of the participants.
One size fits all only applies to rain ponchos.

By making Post-it notes available to all participants, the introverts of the lot could write their responses and thoughts — the insights of which would otherwise never come to surface and stowed away for fears of sharing publicly.
Working together-alone has two main benefits
Avoid Creative Typecasting: The process plays to both creative types, and it empowers the team to bring out the best in each other.
Avoid Groupthink: Brainstorming sessions have a nasty habit of driving the group to consensus.
I collated the findings to look for insights and themes. For me this process was a big win. It was inclusive, open and a the students welcomed telling their stories. While each story is unique in a way, it found itself in clusters of themes that were the motivations.
Historically the business had not run any qualitative practice at scale before, so this exercise was very refreshing for the teams. After running the pilot exercise, we prioritised the vocations offered by the business on the basis of intake capacity, available funding and revenue streams.

Together-Alone
The numbers
Simultaneously, I dived deep in the CRM data, going back 3 years, for quantitative findings of the participant’s source of admission, ethnicities, qualifications, etc by location and campus. I laid this information in to a template for basic information visualisation for the teams to consume.

I also referred to the data collected from annual survey for 2017/18/19 (the only research practice the business had). Although there was no clarity on the Confidence level or the Confidence Interval of these surveys, the population the data was collected from was large enough for me to be able to work with and apply these values from the understanding I was building whist running the qualitative process.
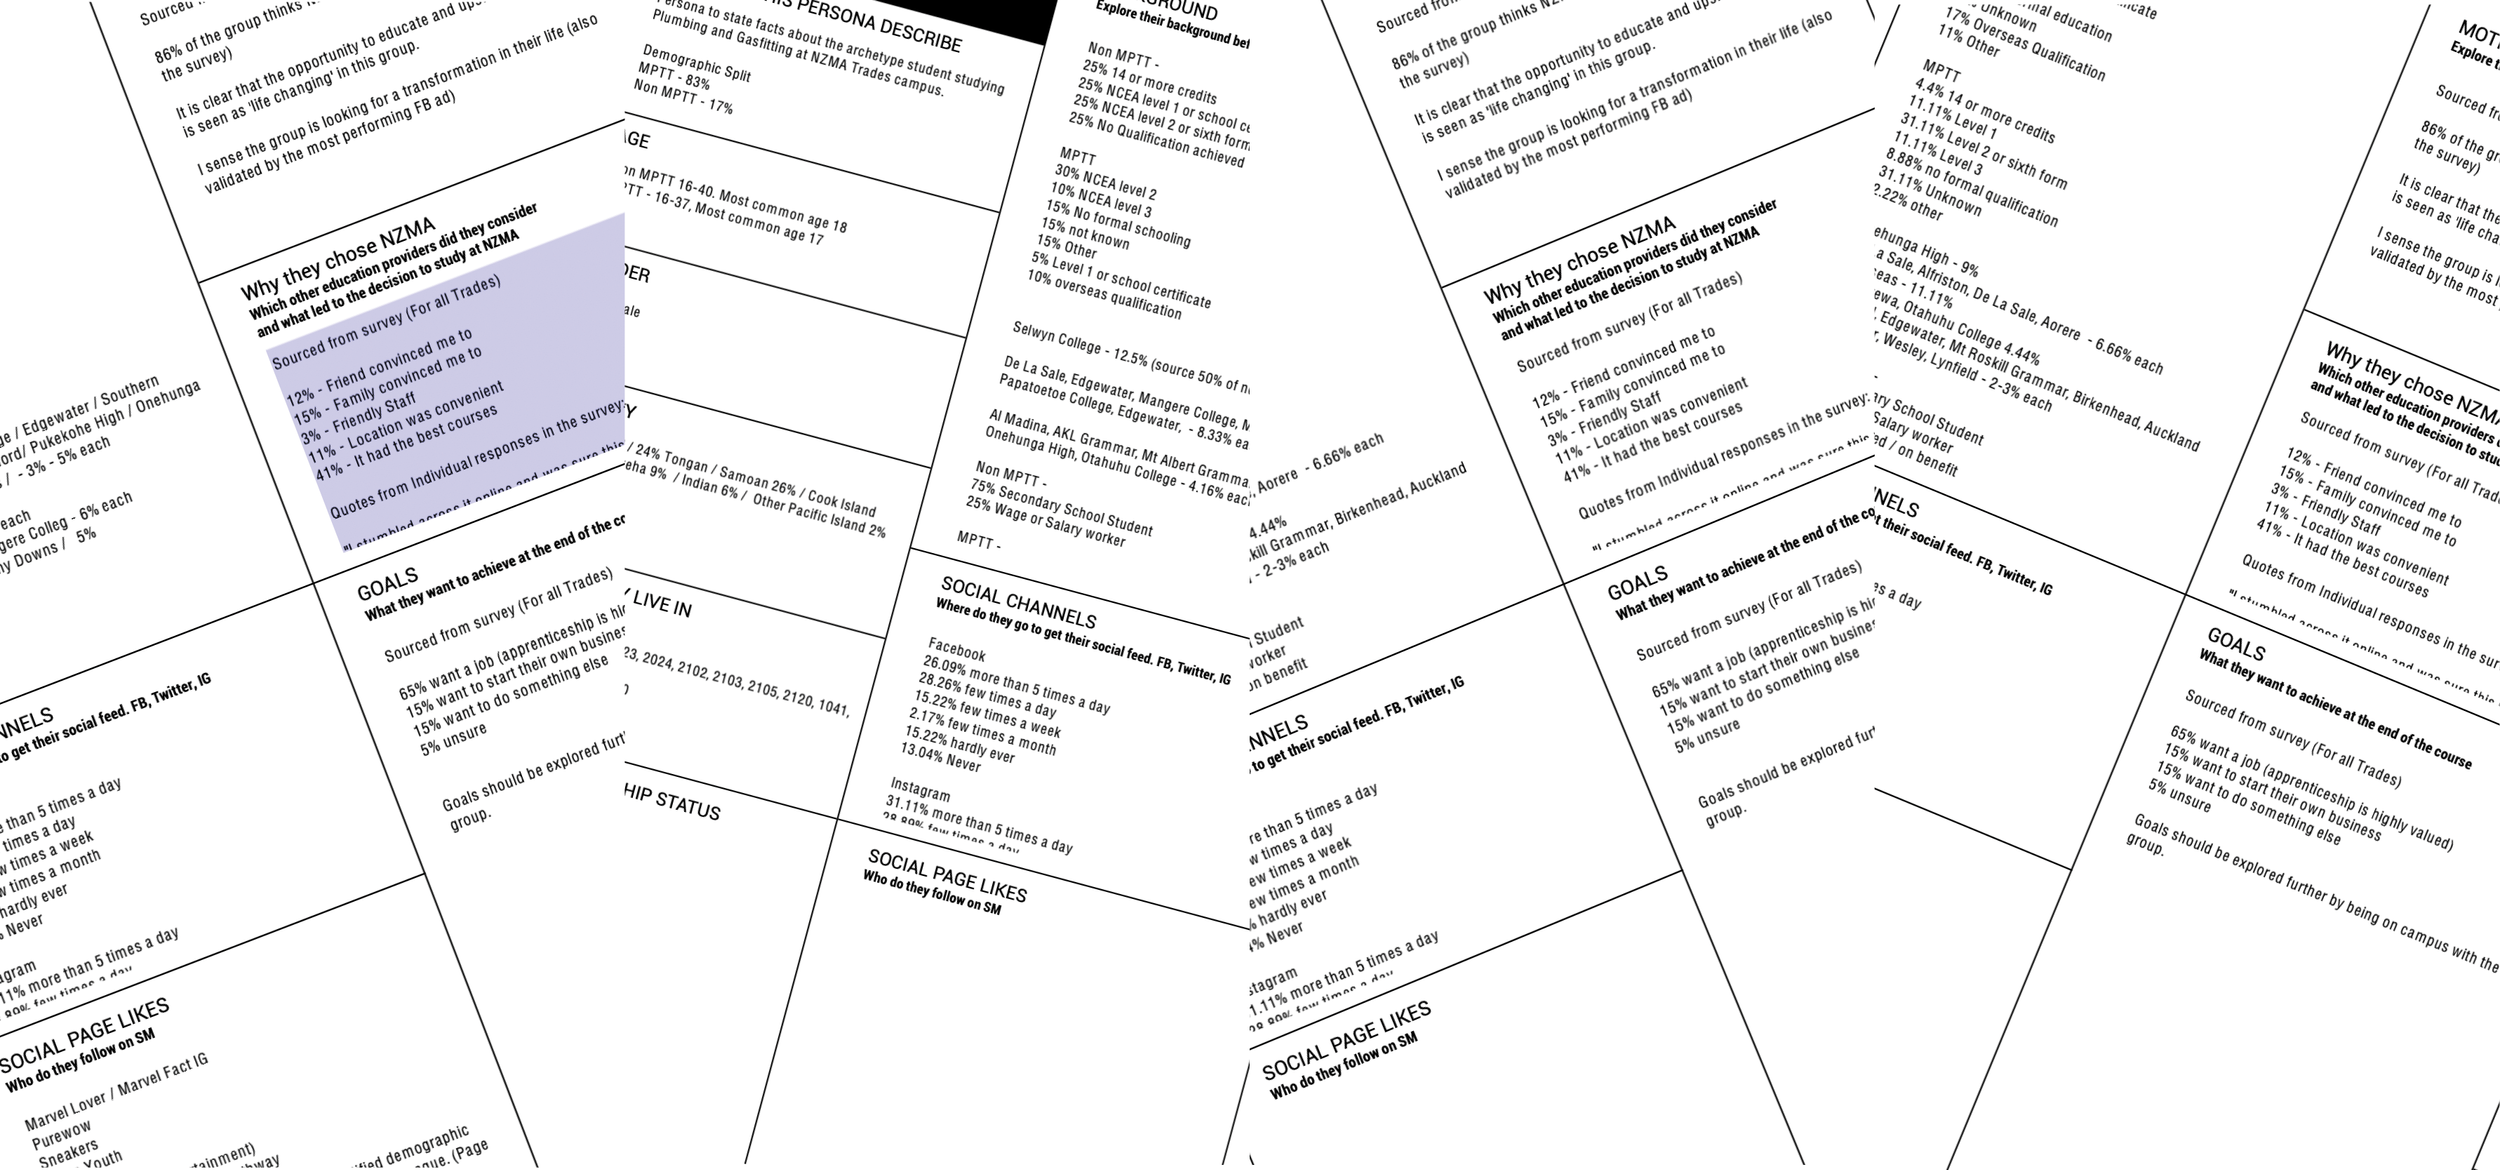
The Canvas
I developed an artefact called a Persona Discovery Canvas to store all the qualitative and quantitative data. This artefact is a living document and will adapt to the changes as per the data it needs to represent–container for the content and not vice versa.
Digital Marketing and brand teams use this tool to tailor campaigns and plan creative for specific programmes. However this lacked empathy—the true purpose and motivator behind any customer centric process. A shared empathy for the customer leads to alignment across teams that otherwise work in silos and work towards disjointed KPIs.
I had developed several goal based for technology users in my previous roles but a marketing persona serves a different purpose. It is a place where all the research done so far comes to life. It allows an individual team member to role play and design a solution for. Feel free to read my thoughts on the topic of Personas here.
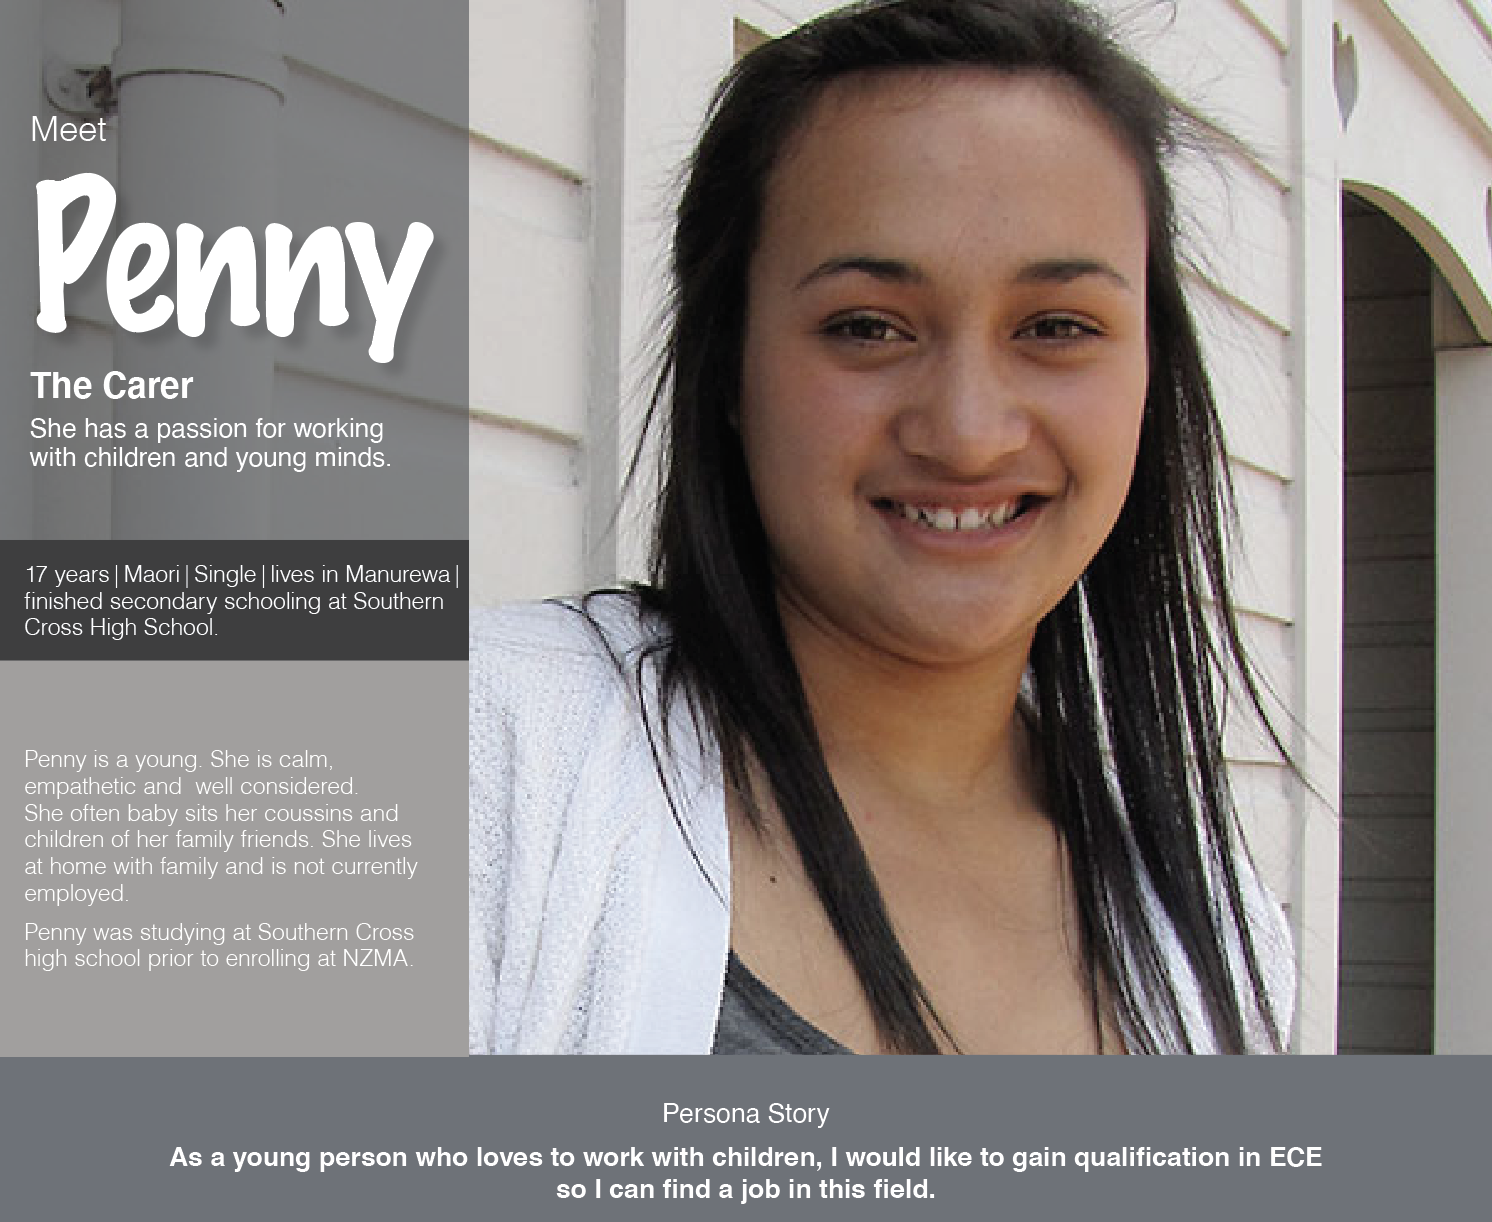
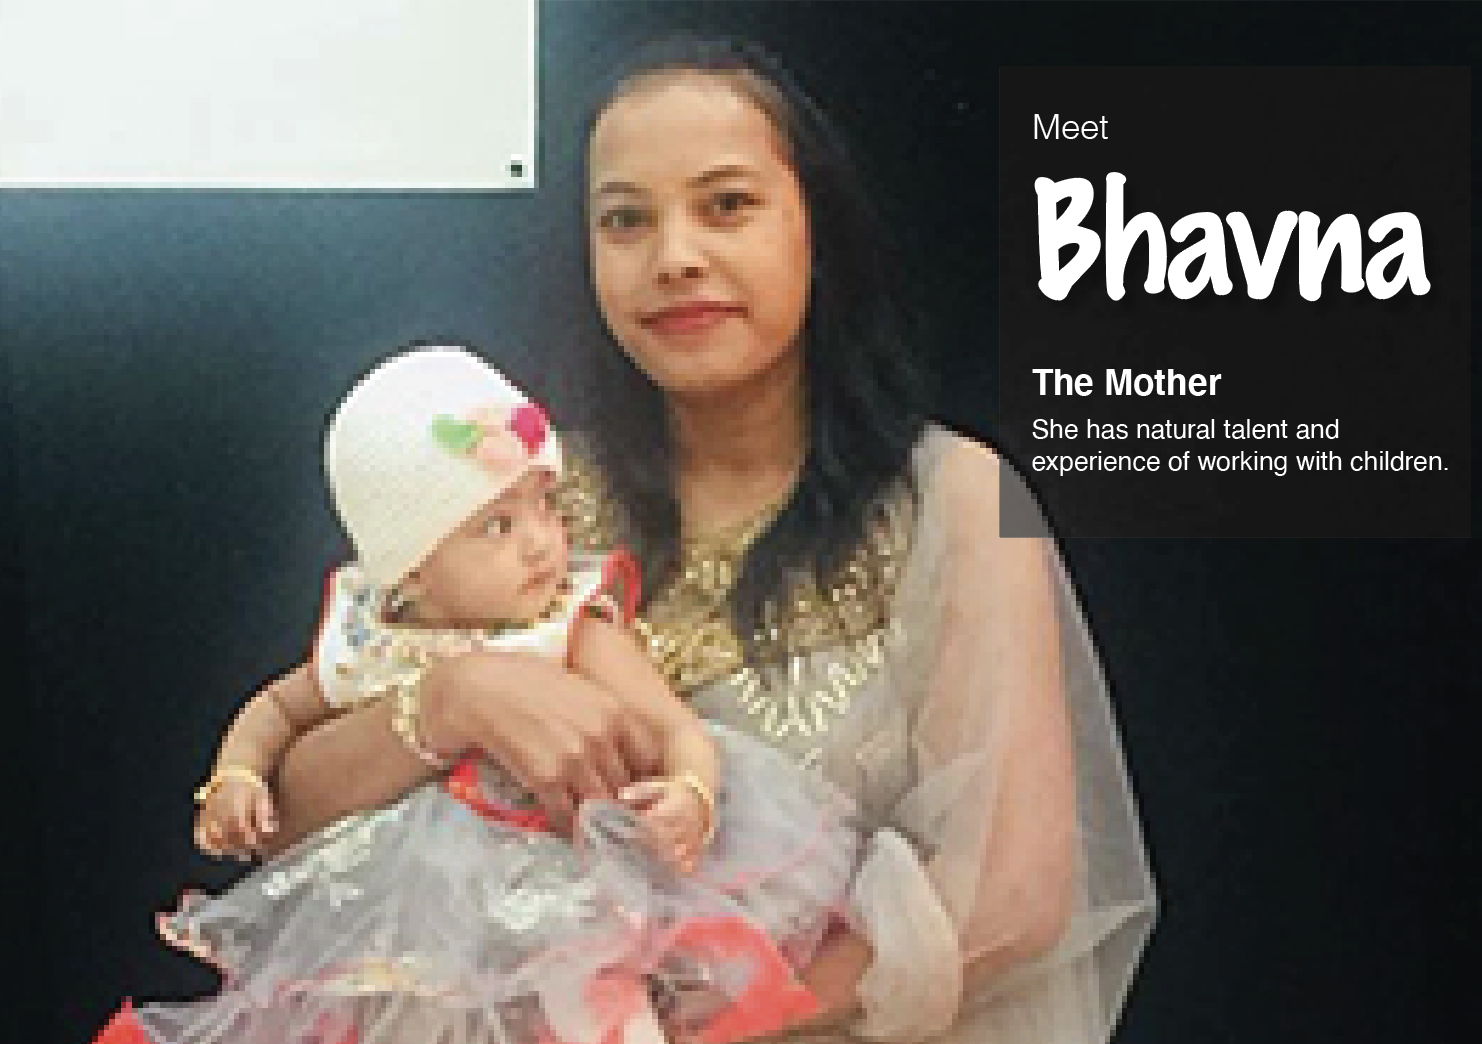
I explored archetypes to merge with the findings from the research. Archetypes are universal, inborn models of people, behaviours, or personalities that play a role in influencing human behaviour.
Doing this, defined the over-arching umbrella to hold the pieces of research findings.

Coming to life


What did this achieve?
I presented these personas to the members of the board and investment committee and received great feedback.
“It feels like someone has told us a big secret”
said one senior member of leadership team, after the presentation.
It helped the brand team develop bespoke collateral and digital assets driven by the personas.
The digital team now had better understanding of the user group to align the budgets and spend thresholds with.
This progress generated a tool that the team would be able to design for and test with, year on year.
This improved the acquisition strategy of the business.
“By getting the right student to start with, we can retain students for longer”
said a senior tutor after one of the workshops in confidence.
This also led the operations and admissions teams to review their onboarding process to be more focussed on the customer.
It aspired to break the organisational silos by bringing teams together to co-design for the customer, in turn, making them feel valued which displayed a visible increase in the stakeholder interest over the lifetime of the project.
Importantly, Personas challenged biases different parts of the business had about how they ‘knew’ the customers and brought agreement to who they were aspiring to serve.